Technology
Interactive: Ranking the 20 Most Valuable Cryptocurrencies Over Time
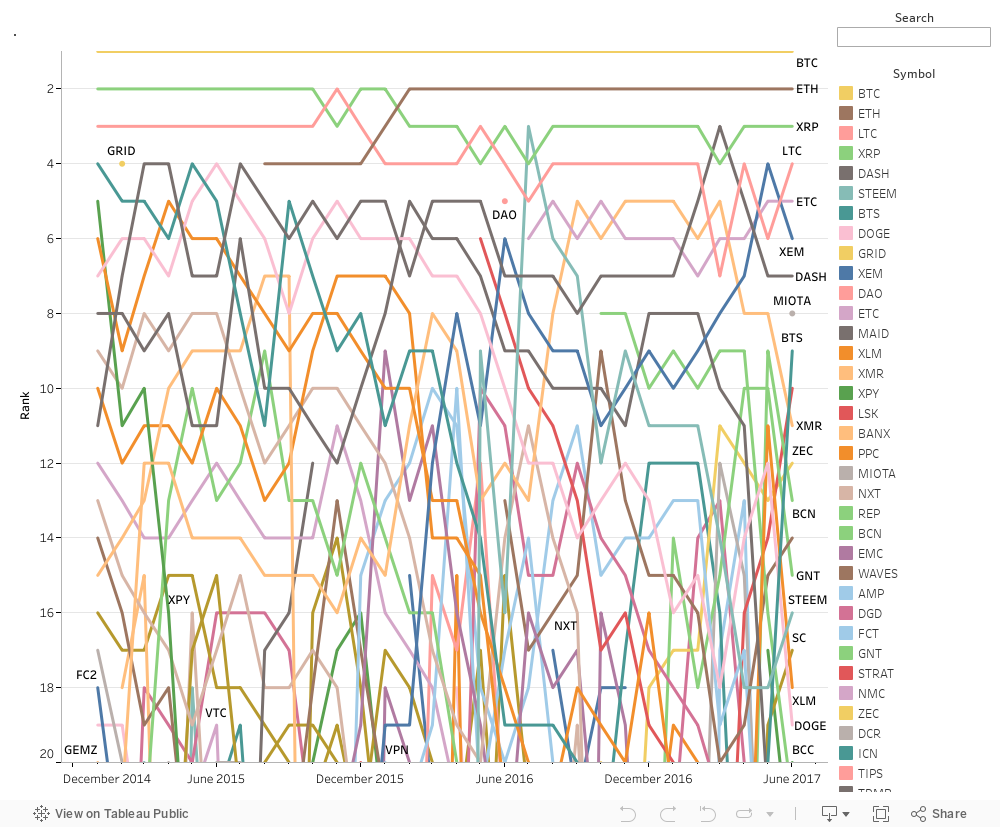
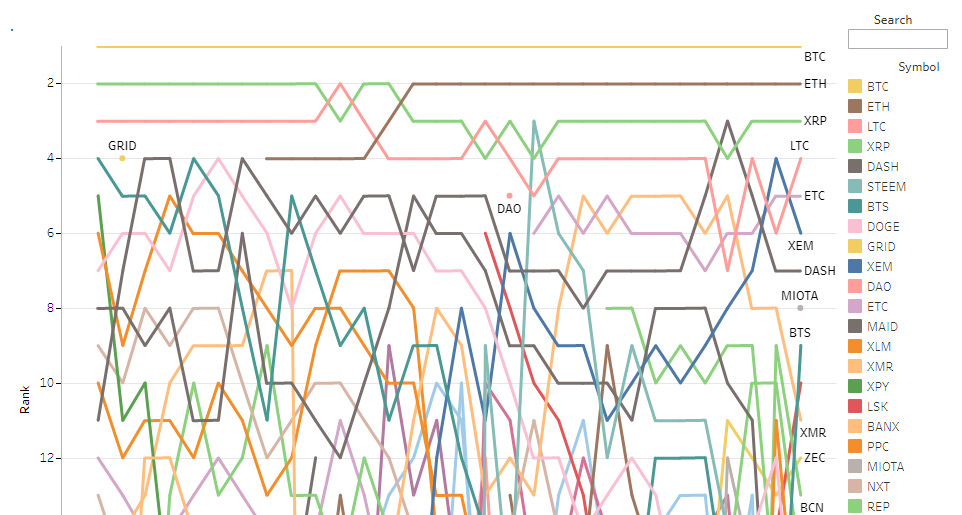
The following interactive visualization sorts and ranks all cryptocurrencies by market capitalization.
var divElement = document.getElementById(‘viz1498757488102’); var vizElement = divElement.getElementsByTagName(‘object’)[0]; vizElement.style.width=’1004px’;vizElement.style.height=’869px’; var scriptElement = document.createElement(‘script’); scriptElement.src = ‘https://public.tableau.com/javascripts/api/viz_v1.js’; vizElement.parentNode.insertBefore(scriptElement, vizElement);
Ranking the 20 Most Valuable Cryptocurrencies Over Time
Many cryptocurrencies have followed Bitcoin, but none have been able to crack its dominance of the digital currency marketplace. The above interactive graphic, by CryptoReach, shows the top 20 cryptocurrencies ranked by market capitalization over the course of the past 2.5 years.
This ranking can teach us about the evolving market for cryptocurrencies and the direction it may take as more and more competing players emerge.
A Matter of Scale
The movement – or lack thereof – of market cap rankings as shown in the chart can be deceiving at first.
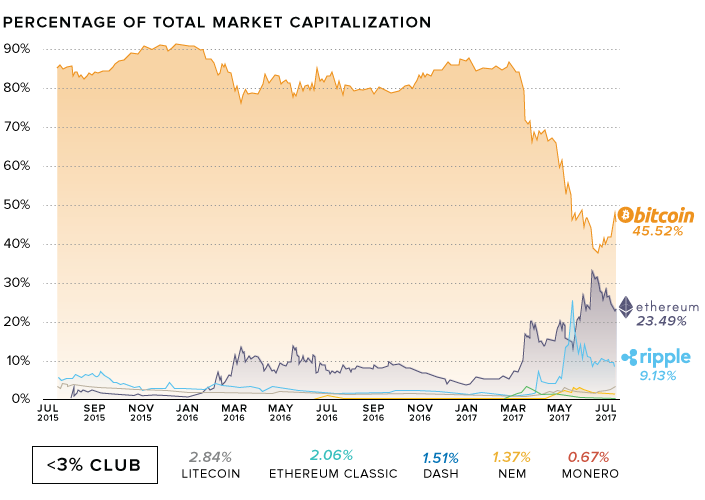
Keep in mind that the rankings, as listed, don’t take the scale of differences in market cap (or coin price) into account. The ever-increasing valuation of Bitcoin is a great example of this. With a market cap recently reaching $40 billion, it surpasses most other cryptocurrencies on the list by an order of magnitude despite only being separated from them by a few ranking points.
Cryptocurrencies Grow Across the Board
Just because a particular currency falls down the rankings doesn’t necessarily mean that its market cap is shrinking: it may simply not be keeping up with the growth of its peers. Dashcoin, for example, fell four ranking points between March and May of the past year despite nearly $200 million of growth in value.
This simply reflects a much broader overall trend: the extraordinary speed at which the cryptocurrency market as a whole is growing in value – that is, until the recent pullback in the last month.
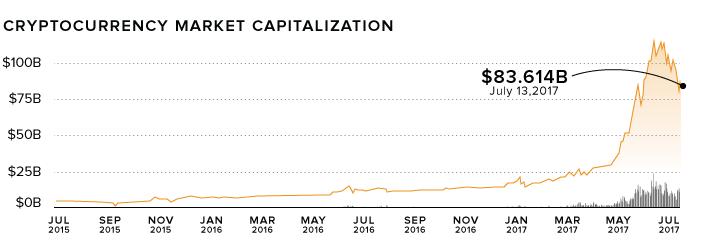
Some mainstream analysts have characterized the rapidly rising valuations of cryptocurrencies in the past several months with words like “insane”, stoking fears of a bubble set to burst. So far that hasn’t happened yet, but it is true that the coin universe has had a significant pullback after powering through $100 billion in value in June 2017.
For anyone that follows the crypto market, they know that such volatility isn’t unusual. Bitcoin has often been either best or worst performing currency in back-to-back years through its short history.
But despite this aforementioned volatility in the market, the coin universe has evolved over time to include many other cryptocurrencies. With the market assigning strong valuations to many different coins, it confirms broad interest in the sector and blockchain as a whole, while helping alleviate some signs of a “bubble about to burst”.
Rise of the Disruptors
As we can see in the above graphics and the interactive chart, Bitcoin has dominated the list of highest-valued cryptocurrency players for close to three years. However, other currencies have recently entered the mainstream, preventing Bitcoin from owning the entire market.
The appearance of the more technologically advanced currency Ethereum on the market in mid-2015 appears to have challenged for Bitcoin’s share of the market, as well as ending the ongoing battle for the second-place ranking between Ripple and Litecoin. In the short span between December 2015 and February 2016 (when it overtook Ripple for the #2 rank,) Ethereum’s market cap grew nearly eight-fold.


Technology
Ranked: Semiconductor Companies by Industry Revenue Share
Nvidia is coming for Intel’s crown. Samsung is losing ground. AI is transforming the space. We break down revenue for semiconductor companies.


Semiconductor Companies by Industry Revenue Share
This was originally posted on our Voronoi app. Download the app for free on Apple or Android and discover incredible data-driven charts from a variety of trusted sources.
Did you know that some computer chips are now retailing for the price of a new BMW?
As computers invade nearly every sphere of life, so too have the chips that power them, raising the revenues of the businesses dedicated to designing them.
But how did various chipmakers measure against each other last year?
We rank the biggest semiconductor companies by their percentage share of the industry’s revenues in 2023, using data from Omdia research.
Which Chip Company Made the Most Money in 2023?
Market leader and industry-defining veteran Intel still holds the crown for the most revenue in the sector, crossing $50 billion in 2023, or 10% of the broader industry’s topline.
All is not well at Intel, however, with the company’s stock price down over 20% year-to-date after it revealed billion-dollar losses in its foundry business.
| Rank | Company | 2023 Revenue | % of Industry Revenue |
|---|---|---|---|
| 1 | Intel | $51B | 9.4% |
| 2 | NVIDIA | $49B | 9.0% |
| 3 | Samsung Electronics | $44B | 8.1% |
| 4 | Qualcomm | $31B | 5.7% |
| 5 | Broadcom | $28B | 5.2% |
| 6 | SK Hynix | $24B | 4.4% |
| 7 | AMD | $22B | 4.1% |
| 8 | Apple | $19B | 3.4% |
| 9 | Infineon Tech | $17B | 3.2% |
| 10 | STMicroelectronics | $17B | 3.2% |
| 11 | Texas Instruments | $17B | 3.1% |
| 12 | Micron Technology | $16B | 2.9% |
| 13 | MediaTek | $14B | 2.6% |
| 14 | NXP | $13B | 2.4% |
| 15 | Analog Devices | $12B | 2.2% |
| 16 | Renesas Electronics Corporation | $11B | 1.9% |
| 17 | Sony Semiconductor Solutions Corporation | $10B | 1.9% |
| 18 | Microchip Technology | $8B | 1.5% |
| 19 | Onsemi | $8B | 1.4% |
| 20 | KIOXIA Corporation | $7B | 1.3% |
| N/A | Others | $126B | 23.2% |
| N/A | Total | $545B | 100% |
Note: Figures are rounded. Totals and percentages may not sum to 100.
Meanwhile, Nvidia is very close to overtaking Intel, after declaring $49 billion of topline revenue for 2023. This is more than double its 2022 revenue ($21 billion), increasing its share of industry revenues to 9%.
Nvidia’s meteoric rise has gotten a huge thumbs-up from investors. It became a trillion dollar stock last year, and broke the single-day gain record for market capitalization this year.
Other chipmakers haven’t been as successful. Out of the top 20 semiconductor companies by revenue, 12 did not match their 2022 revenues, including big names like Intel, Samsung, and AMD.
The Many Different Types of Chipmakers
All of these companies may belong to the same industry, but they don’t focus on the same niche.
According to Investopedia, there are four major types of chips, depending on their functionality: microprocessors, memory chips, standard chips, and complex systems on a chip.
Nvidia’s core business was once GPUs for computers (graphics processing units), but in recent years this has drastically shifted towards microprocessors for analytics and AI.
These specialized chips seem to be where the majority of growth is occurring within the sector. For example, companies that are largely in the memory segment—Samsung, SK Hynix, and Micron Technology—saw peak revenues in the mid-2010s.

-

 Mining2 weeks ago
Charted: The Value Gap Between the Gold Price and Gold Miners
-

 Real Estate1 week ago
Ranked: The Most Valuable Housing Markets in America
-

 Business1 week ago
Charted: Big Four Market Share by S&P 500 Audits
-

 AI1 week ago
The Stock Performance of U.S. Chipmakers So Far in 2024
-

 Misc1 week ago
Almost Every EV Stock is Down After Q1 2024
-

 Money2 weeks ago
Where Does One U.S. Tax Dollar Go?
-

 Green2 weeks ago
Ranked: Top Countries by Total Forest Loss Since 2001
-

 Real Estate2 weeks ago
Visualizing America’s Shortage of Affordable Homes